MAAP #66: Satellite Images of Belo Monte Dam Project (Brazil)

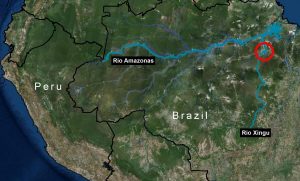
Image 66a. Red circle indicates dam project area.

The Belo Monte hydroelectric dam complex, located on the Xingu River in the state of Para in the eastern Brazilian Amazon (see Image 66a), has been controversial since its inception over 15 years ago, due to both environmental and social concerns related to building and operating one of the largest dams in the world in a sensitive environment.

The dam has recently become operational, providing an opportunity to evaluate initial impacts.

The objective of this article is to present satellite imagery, including a time series from 2011 to 2017, that provides insight into major ecological impacts of the hydroelectric dam project.

Image 66b. NASA/USGS

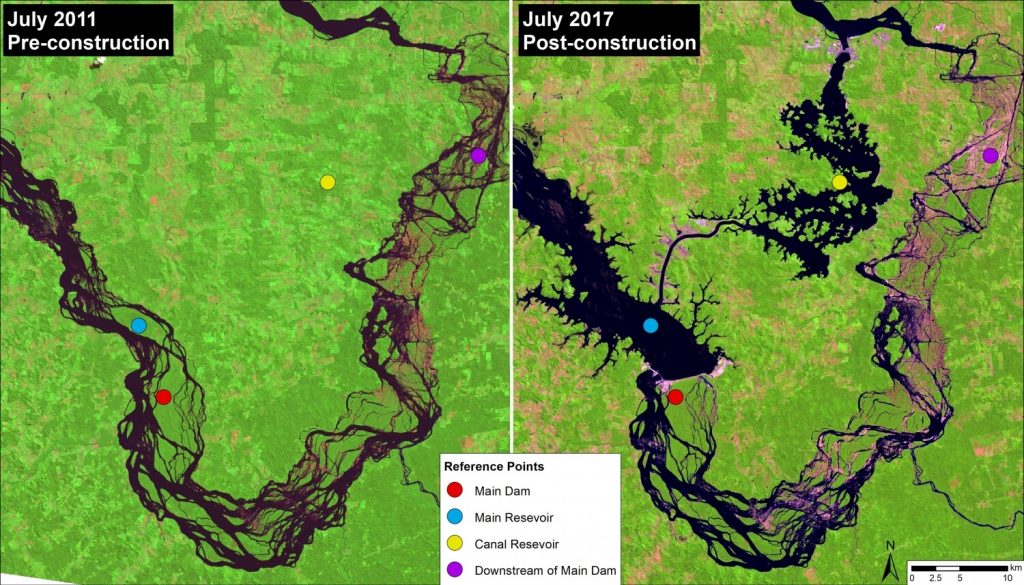
Despite legal challenges and strong opposition from impacted indigenous groups, construction of Belo Monte began in 2011 and the first turbines became operational in early 2017. Image 66b shows a direct comparison of before (left panel, July 2011) and after (right panel, July 2017) dam construction.

The dam is in fact a complex: the main dam (red circle) on the Xingu River creates a main reservoir (blue circle); a canal diverts much (up to 80%) of the river’s flow from the main reservoir to the canal reservoir (yellow circle), which feeds the turbines generating the electricity. As a result, downstream of the main dam is left with a much reduced flow (20%) for a stretch of 100 km. This reduced flow stretch, known as the Xingu River’s “Big Bend,” is home to two indigenous peoples (Arara and Juruna). The reference points in the images show these four areas of the complex across time, including before construction.

MAAP #65: Deforestation Hotspots Of 2017 in The Peruvian Amazon

In an earlier report, MAAP #40, we highlighted the power of combining early warning GLAD* alerts with analysis of high-resolution satellite images (for example, from the company Planet), as part of a comprehensive near real-time deforestation monitoring system.


In the current report, we analyze the GLAD alerts for the first half of 2017 (through July 17) to identify current deforestation hotspots in the Peruvian Amazon.** These alerts indicate an estimated total forest loss of 37,000 acres (15,000 hectares) thus far during the year.

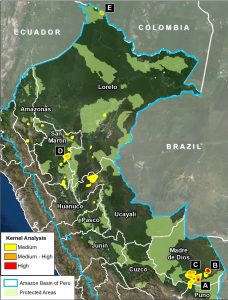
Image 65 (see right) highlights the 2017 deforestation hotspots, defined here as areas with medium to high density of forest loss.

Below, we describe and show images of the most intense hotspots, indicated in red and orange.

Image 65. Data: MINAM/PNCB, UMD/GLAD, SERNANP, MAAP

These areas include:

  • Buffer zones of Tambopata National Reserve and Cordillera Azul National Park
  • Natural loss due to blowdowns from “hurricane winds,” in the Madre de Dios region
  • Northwest border with Colombia

MAAP #64: Good News Deforestation Stories (Peruvian Amazon)


We admit that most MAAP stories are about the bad news of Amazon deforestation. But fortunately
 

 there is good news as well.

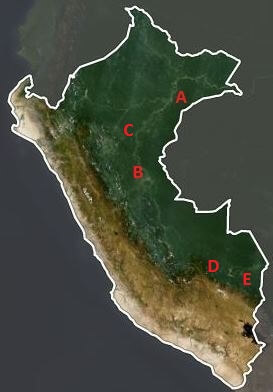
Here we highlight 5 good news stories from the Peruvian Amazon that show how near real-time monitoring may lead to halting deforestation from emerging threats, such as gold mining and large-scale agriculture (oil palm and cacao plantations).

The detailed cases are:

A) United Cacao (cacao),

B) Plantations of Pucallpa (oil palm),

C) Grupo Romero (oil palm),

D) Amarakaeri Comunal Reserve (gold mining), and

E) Tambopata National Reserve (gold mining).


United Cacao

Image 64a. Data: NASA/USGS

Image 64a. Data: NASA/USGS

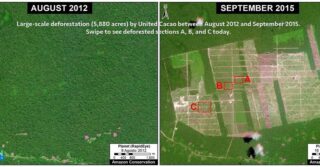
The rapid deforestation of primary forest for a large-scale cacao plantation in the northern Peruvian Amazon took everyone by surprise in 2013. Civil society led the way in exposing and tracking the deforestation with satellite imagery and the government eventually confirmed the forest loss data. For its part, MAAP published 6 articles (for example MAAP #35 and MAAP #2).

Although total deforestation eventually reached 5,880 acres (2,380 hectares), the company, due to a complicated combination of factors, was suspended from the London Stock Exchange and no new deforestation has been detected in over a year.

Image 64a shows that the cacao project area was covered by intact forest in late 2012, followed by large-scale deforestation of primary forest in 2013. The deforestation slowed, and then stopped, between 2014 and 2017. The yellow circle indicates the cacao plantation area over time.


Plantations of Pucallpa (oil palm)

In a remarkable case, satellite imagery was used to demonstrate that an oil palm company (Plantations of Pucallpa) had breached the Code and Conduct of the RSPO (Roundtable on Sustainable Palm Oil), a non-profit entity founded to develop and implement global standards for sustainable palm oil.

In 2015, the Native Community of Santa Clara de Uchunya (with the support of the NGO Forest Peoples Programme) presented an official complaint to the RSPO against Plantations of Pucallpa, a member of the roundtable. An important component of the complaint alleged massive deforestation, but the company adamantly denied it. MAAP articles showing the deforestation of 15,970 acres (6,460 hectares) were used as evidence (MAAP #4, MAAP #41), as was independent government analysis.

In April 2017, the RSPO concluded that Plantations of Pucallpa cleared 14,145 acres (5,725 hectares) despite declaring no land-clearing, thus breaching the Code and Conduct. Several months prior this decision, the company divested its oil palm estates and withdrew from the RSPO. We have not detected any new deforestation in the project area in over a year.

Image 64b shows the massive deforestation for two large-scale oil palm plantations in the central Peruvian Amazon (Plantations of Pucallpa is the plantation to the north). The yellow circles indicate the oil palm plantation project areas over time. Note that the project area was a mix of primary and secondary forest in 2011, immediately prior to the deforestation, which began in 2012. The deforestation intensified in 2013 before nearly reaching its maximum extent in 2015. We have not detected any new deforestation since 2016.
Image 64b. Data: NASA/USGS, MAAP

Grupo Romero (oil palm)

Perhaps the best news of the bunch is about four large-scale oil palm plantations that were stopped before any deforestation occurred. As detailed in a recent report by Environmental Investigation Agency, the Peruvian business conglomerate Grupo Romero conducted environmental impact studies for four new oil palm plantations in the northern Peruvian Amazon. Analysis of these studies revealed that these plantations would cause the massive deforestation of 56,830 acres (23,000 hectares) of primary forest. After strong pushback from civil society, including legal action, a recent report from Chain Reaction Research revealed that Grupo Romero is now working towards a zero-deforestation supply chain and thus found that the four planned plantations are no longer feasible and abandoned the projects.

Image 64c shows how the project area for two of the proposed oil palm plantations (in yellow), Santa Catalina and Tierra Blanca, is largely covered by intact, primary forest.
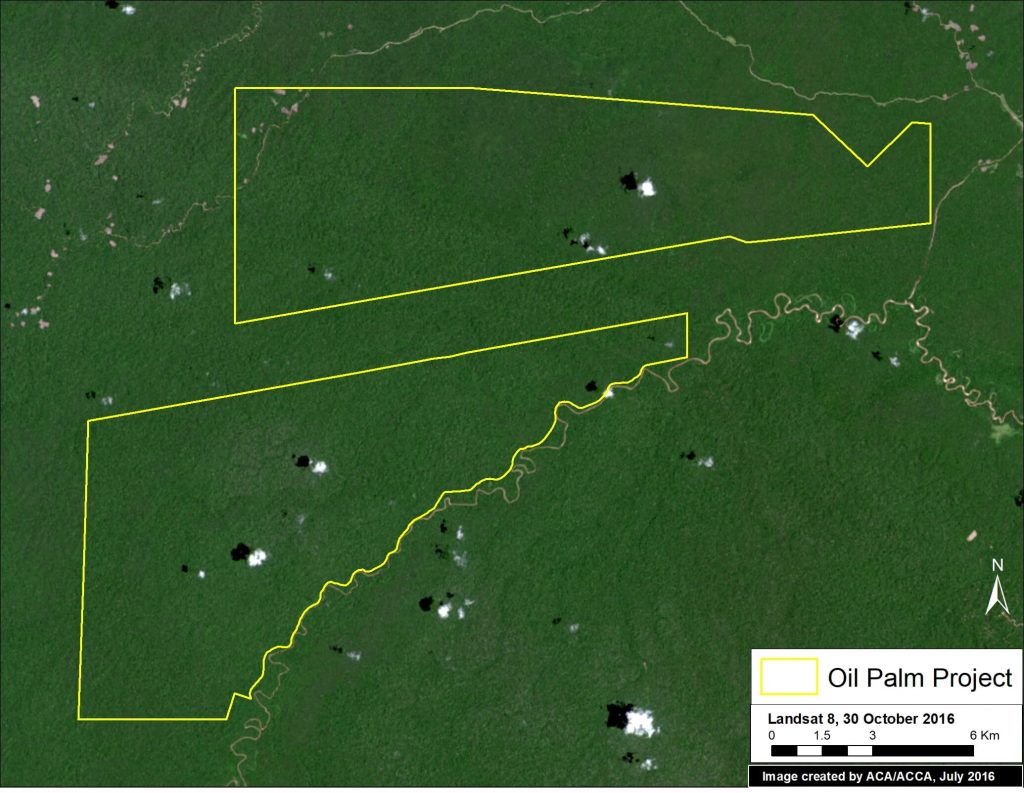
Image 64c. Data: NASA/USGS, Grupo Palmas (Grupo Romero)

Amarakaeri Communal Reserve (gold mining)

In June 2015, we revealed the deforestation of 11 hectares in Amarakaeri Communal Reserve due to an illegal gold mining invasion. The Reserve, located in the southern Peruvian Amazon, is an important protected area that is co-managed by indigenous communities (ECA Amarakaeri) and SERNANP, Peru’s protected areas agency (see MAAP #6). In the following weeks, the Peruvian government, led by SERNANP, cracked down on the illegal mining activities. A year later, we showed that the deforestation had been stopped, with no further expansion into the Reserve (MAAP #44). In fact, we showed that there were signs of recovering vegetation on the recently mined areas.

Image 64d shows the gold mining deforestation approaching (2011-12) and entering (2013-15) Amarakaeri Communal Reserve (yellow circles indicate areas of invasion). However, it also shows how, following action by the government and ECA Amarakaeri, the deforestation was halted and did not expand in 2016-17.
Image 64d. Data: NASA/USGS, Sentinel/ESA, RapidEye/Planet

Tambopata National Reserve (gold mining)

In September 2015, illegal gold miners started to invade Tambopata National Reserve, an important protected area in the southern Peruvian Amazon with world renowned biodiversity. In a series of MAAP articles, we tracked the invasion as it intensified in 2016, and eventually reached 1,360 acres (550 hectares) by early 2017. However, by late 2016, the Peruvian Government intensified its interventions against the illegal mining activity, and the rate of deforestation quickly and sharply decreased. In the most recent satellite imagery, we have not detected any major new expansion of illegal gold mining within the Reserve.

Image 64e shows the initial invasion of Tambopata National Reserve between September 2015 and January 2016. The deforestation within the Reserve intensifies during 2016, but slows significantly in 2017. The yellow circles indicate areas of invasion.
Image 64e. Data: Planet, SERNANP

References

Planet Team (2017). Planet Application Program Interface: In Space for Life on Earth. San Francisco, CA. https://api.planet.com.


Citation

Finer M, Novoa S, Olexy T, Scott A (2017) Good News Deforestation Stories (Peruvian Amazon). MAAP: 64.

MAAP #63: Patterns of Deforestation in the Colombian Amazon

We are excited to present our initial analysis of the Colombian Amazon, a work that reflects an important collaboration with our colleagues at Amazon Conservation Team. It is also our first report in the more interactive “Story Map” format.

This report has two objectives: 1) Illustrate the major deforestation hotspots in the Colombian Amazon between 2001 and 2015 and 2) Focus in on one of the most important hotspots, located in the Caquetá department. In short, we show satellite imagery of the expanding forest loss in one of the most important deforestation hotspots in the Colombian Amazon.

Please follow this link to view the Story Map: https://maaproject.org/maap-deforestation-patterns-colombian-amazon/

MAAP #62: Fire, Rain, And Deforestation in The Peruvian Amazon

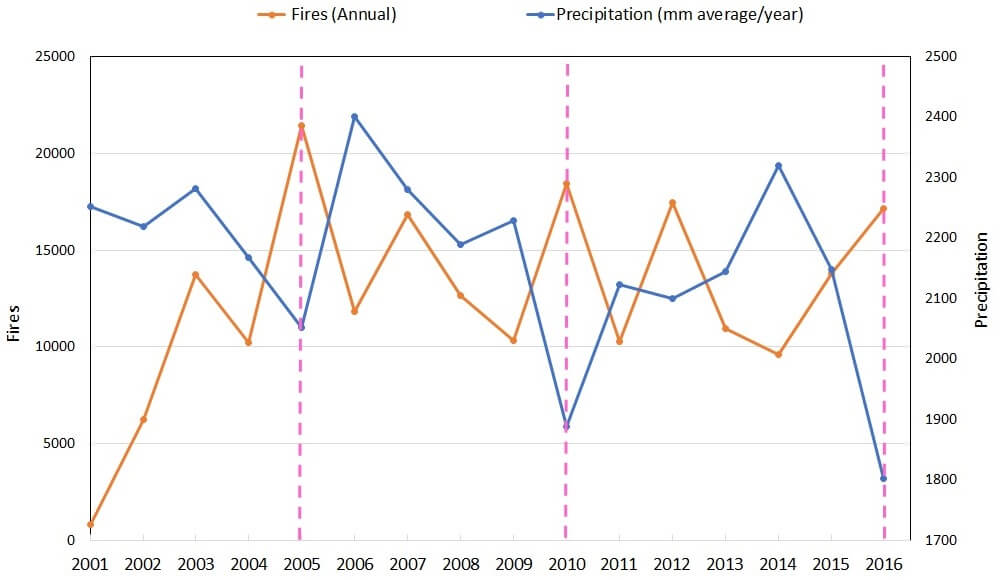
In 2016, Peru experienced an intense forest fire season (MAAP #52, MAAP #53). A leading hypothesis was that intense drought facilitated the escape of agricultural burns. To investigate, this report analyzes the dynamic between fires and precipitation over the past 15 years, finding a strong temporal correlation (Image 62a). We also investigate the link between fires and forest loss, finding a spatial correlation.

Image 62a. Data: TRMM, FIRMS/NASA, PNCB/MINAM, GLAD/UMD

MAAP #61: Illegal Gold Mining Decreases in Tambopata National Reserve

In the previous MAAP #60, we showed the rapidly increasing illegal gold mining deforestation in the buffer zone of Tambopata National Reserve. In contrast, here we show that the rate of illegal gold mining deforestation is decreasing within Tambopata National Reserve, due to the active interventions by the Peruvian Government. Tambopata is an important protected area in the southern Peruvian Amazon due to its high biodiversity.


Image 61. Data: Planet, MAAP, SERNANP

MAAP #60: Gold Mining Increases in Buffer Zone Of Tambopata National Reserve

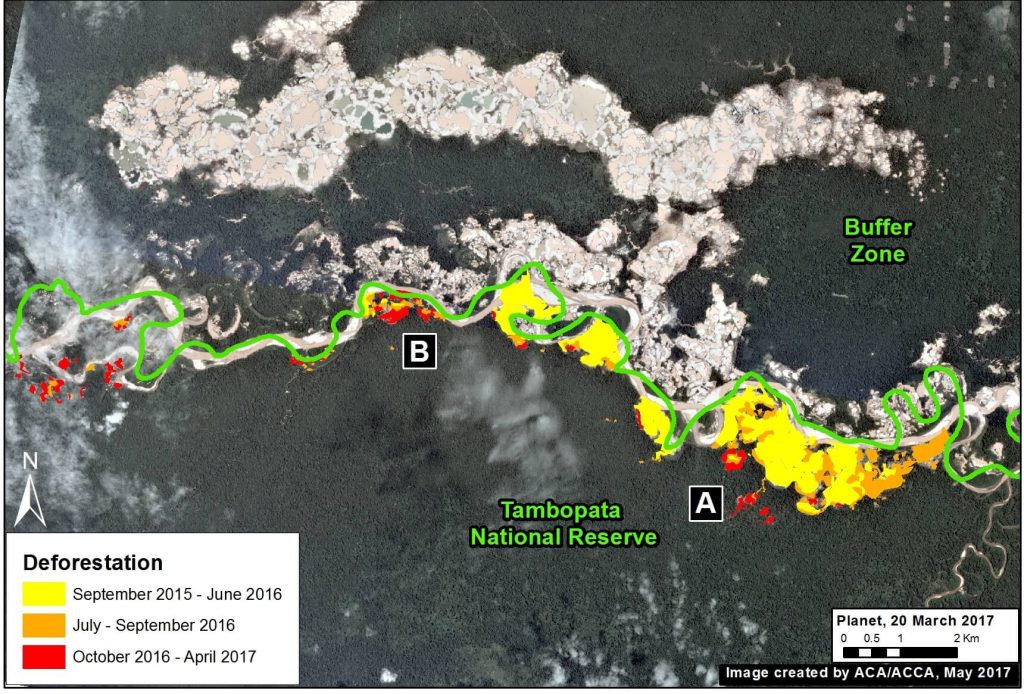
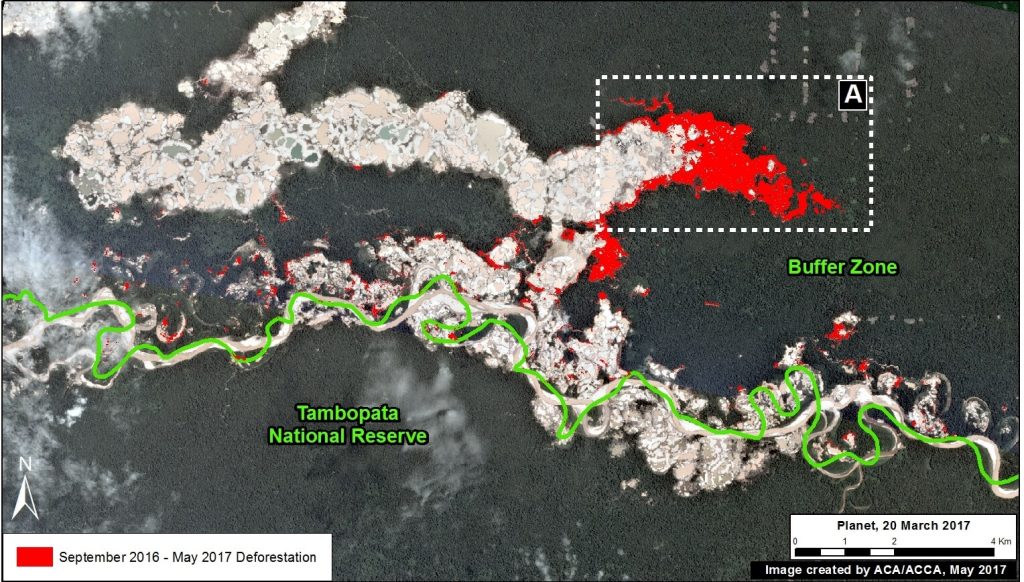
In the previous MAAP #50, we presented an analysis of the extent of gold mining deforestation in the southern Peruvian Amazon as of September 2016. Here, we partially update the data for the area within the buffer zone of Tambopata National Reserve.* We document the increase of 1,135 acres (460 hectares) of illegal mining deforestation during the last 8 months, from September 2016 to May 2017 (see red in Image 60). That brings the total deforested area in the buffer zone to 10,970 acres (4,440 hectares) since 2012.


Image 60. Data: Planet, MAAP, SERNANP

*The buffer zone does not form part of the respective protected area, thus it is not under the jurisdiction of the Peruvian national protected areas agency, SERNANP. However, the illegal activities that are being carried out in the buffer zone are putting the conservation values of the protected area at risk, and are under the jurisdiction of other entities in the Peruvian government.

MAAP #59: Power Of “Small Satellites” From Planet


The company Planet is pioneering the use of high-resolution “small satellites” (Image 59a). They are a fraction of the size and cost of traditional satellites, making it possible to produce and launch many as a large fleet. Indeed, Planet now operates 149 small satellites, known as Doves, the largest fleet in history. The Doves capture color imagery at 3-5 meter resolution, and will line up (like a string of pearls) to cover everywhere on Earth’s land area every day.

Image 59a. Source: Planet

Over the past year, MAAP* has demonstrated the power of Planet imagery to monitor deforestation and degradation in near real-time in the Amazon. A consistent flow of new, high-resolution imagery is needed for this type of work, making Planet’s fleet model ideal. Below, we provide a recap of key MAAP findings based on Planet imagery, for a diverse set of cases including gold mining, agriculture deforestation, logging roads, wildfire, blowdowns, landslides, and floods.**

*MAAP has been fortunate to have access to Planet imagery via the Ambassador program.
**Note: In the images below, the red dot () indicates the same location across time between panels.

MAAP #58: Link Between Peru’s Flooding and Warm Coastal Waters

In previous articles MAAP #56 and MAAP #57, we presented a series of striking satellite images of the recent deadly floods in northern Peru. Satellites provide additional types of data critical to better understanding events such as extreme flooding. Here, we present two more types of satellite data related to the flooding: ocean water temperature and precipitation.