MAAP #40: Early Warning Deforestation Alerts in The Peruvian Amazon

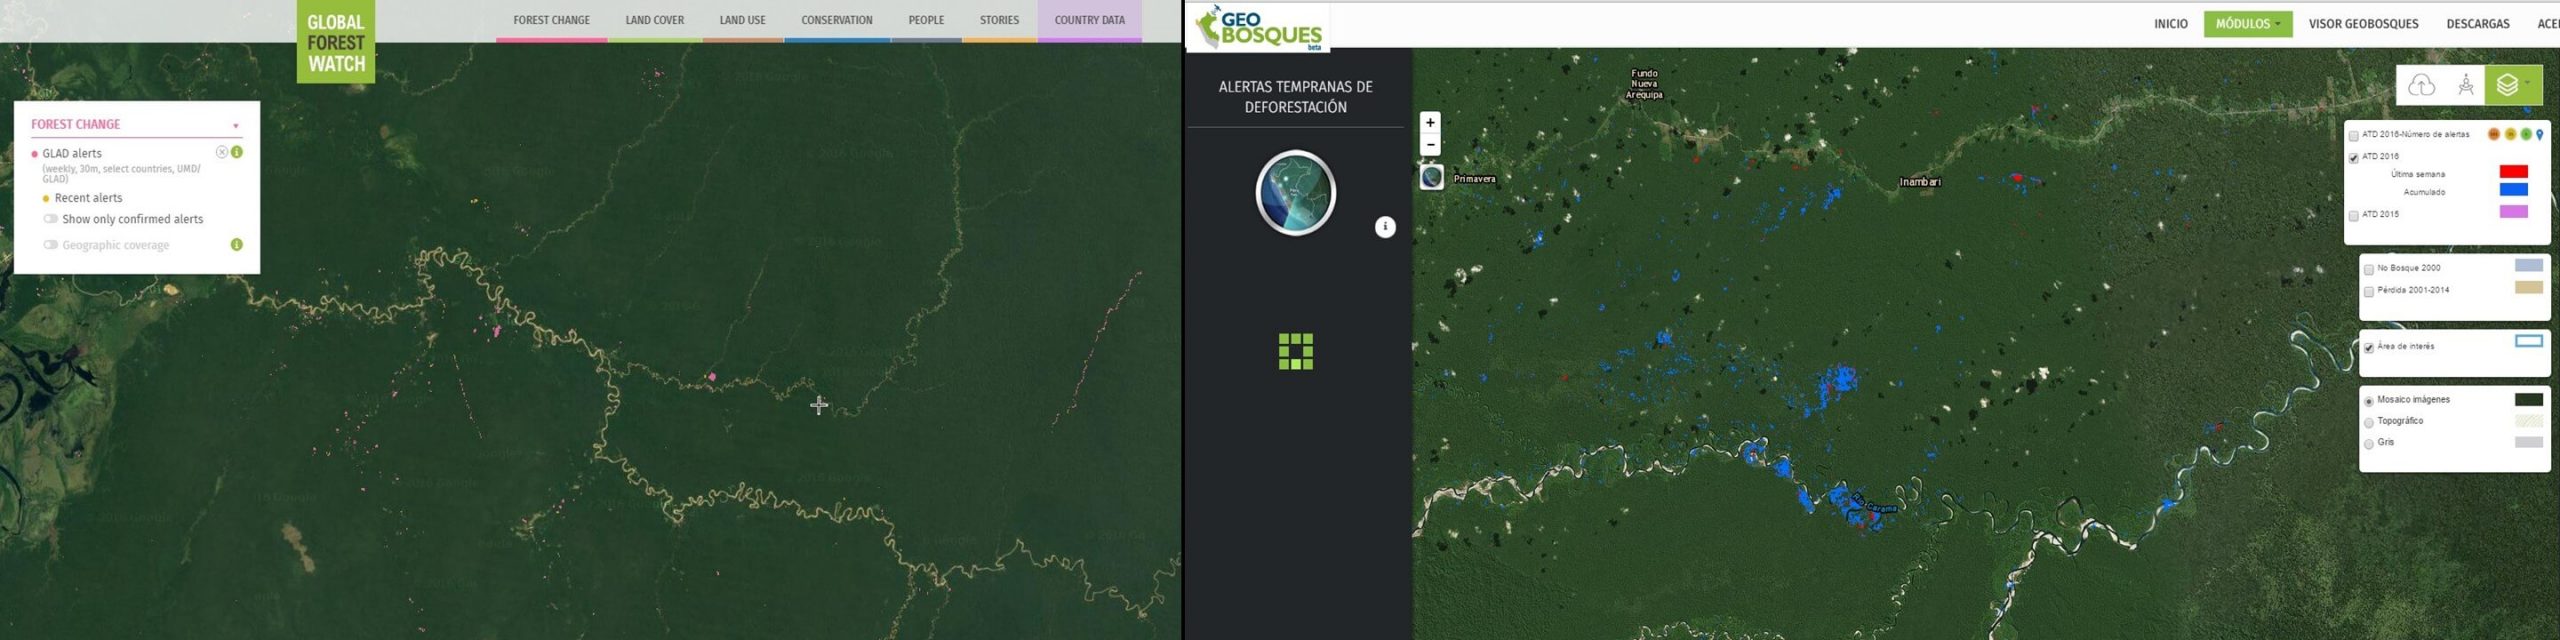
GLAD alerts are a powerful new tool to monitor forest loss in the Peruvian Amazon in near real-time. This early warning system, created by the GLAD (Global Land Analysis and Discovery) laboratory at the University of Maryland and supported by Global Forest Watch, was launched in March 2016 as the first Landsat-based (30-meter resolution) forest loss alert system (previous systems were based on lower-resolution imagery). The alerts are updated weekly and can be accessed through Global Forest Watch (Image 40a, left panel) or GeoBosques (Image 40a, right panel), a web portal operated by the Peruvian Ministry of Environment.

Image 40a. Data: UMD/GLAD, WRI/GFW, PNCB/MINAM

In MAAP, we often combine these alerts with analysis of high-resolution satellite imagery (courtesy of the Planet Ambassador Program and Digital Globe NextView service) to better understand patterns and drivers of deforestation in near real-time. In this article, we highlight 3 examples of this type of innovative analysis from across the Peruvian Amazon:

Example 1: Logging Roads in central Peru (Ucayali)
Example 2: Invasion of Ecotourism Concessions in southern Peru (Madre de Dios)
Example 3: Buffer Zone of Cordillera Azul National Park (Loreto)


Example 1: Logging Roads in central Peru (Ucayali)

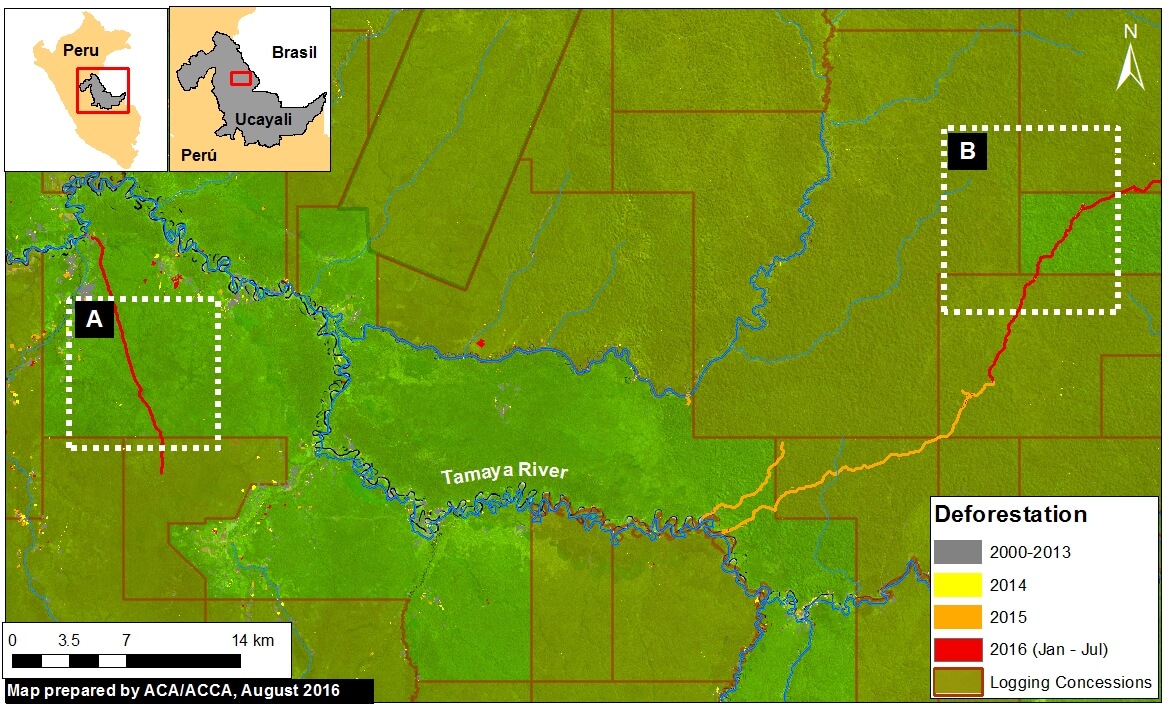
In the previous MAAP #18, we documented the proliferation of logging roads in the central Peruvian Amazon during 2015. In recent weeks, we have seen the start of rapid new logging road construction for 2016. Image 40b shows the linear forest loss associated with two new logging roads along the Tamaya river in the remote central Peruvian Amazon (Ucayali region). Red indicates the 2016 road construction (35.8 km). Insets A and B indicate the areas shown in the high-resolution zooms below.

Image 40b. Data: UMD/GLAD, Hansen/UMD/Google/USGS/NASA, MINAGRI

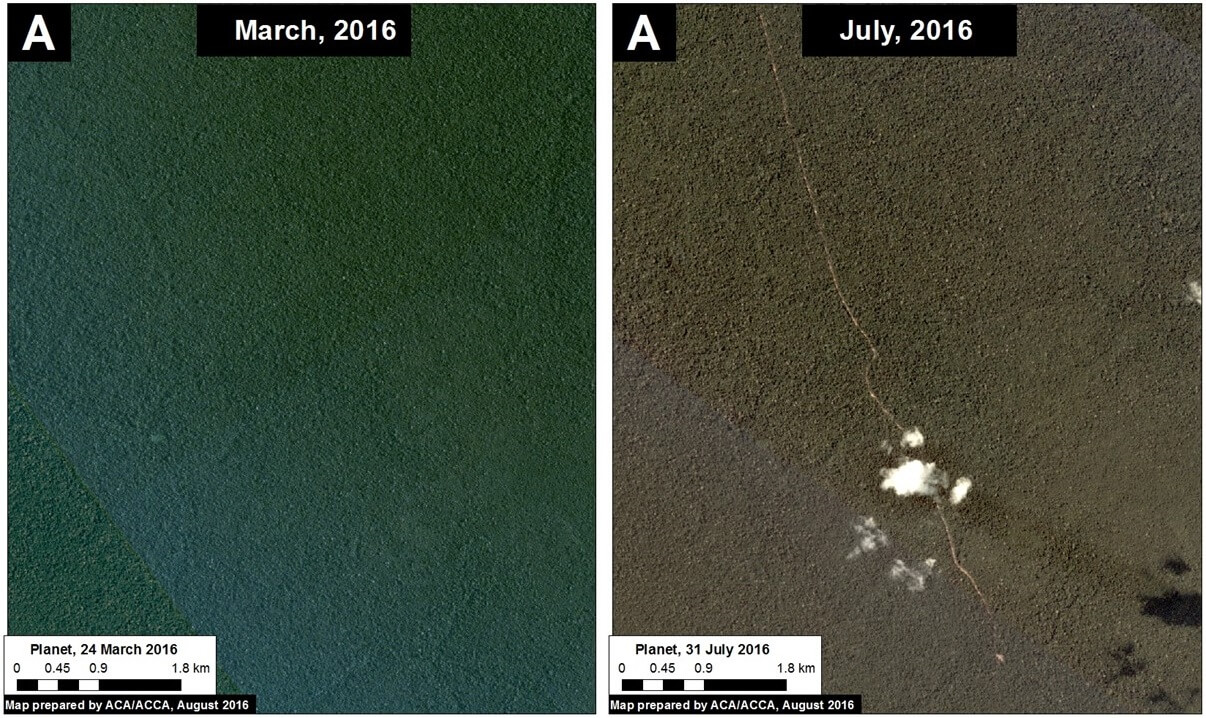
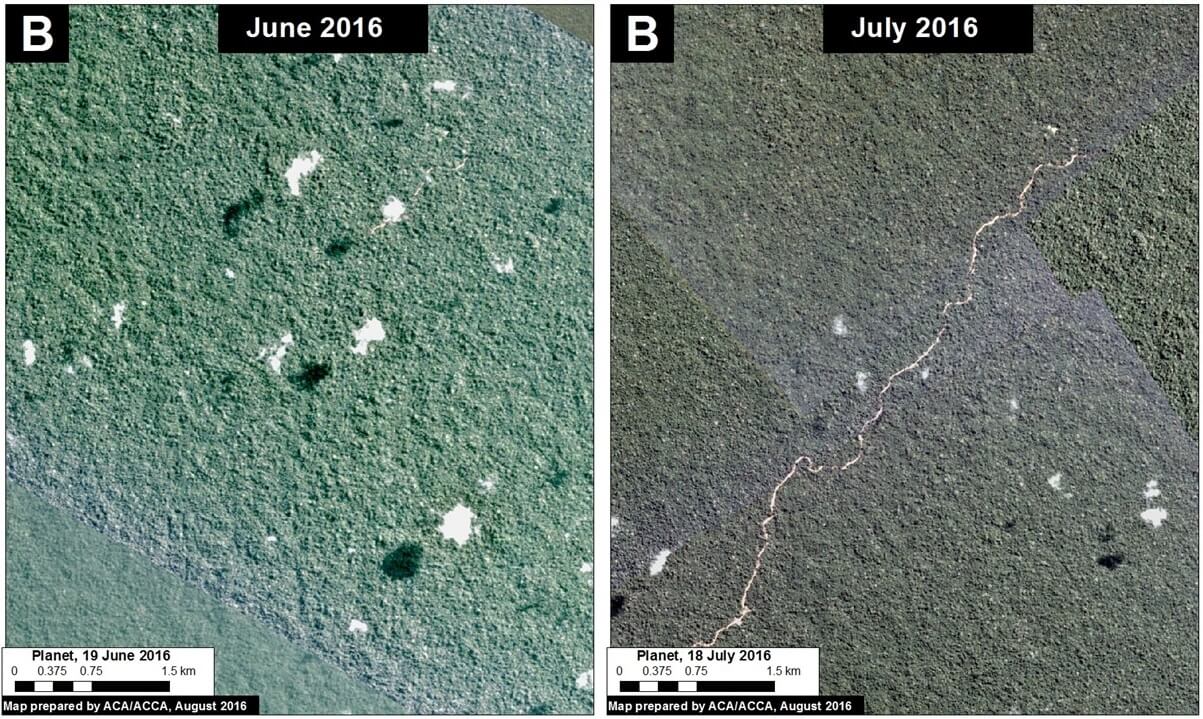
The following images show, in high-resolution, the rapid construction of logging roads in 2016. Image 40c shows the construction of 16.1 km between March (left panel) and July (right panel) 2016 in the area indicated by Inset A. Image 40d shows the construction of 19.7 km between June (left panel) and July (right panel) 2016 in the area indicated by Inset B.

Image 40c. Data: Planet
Image 40d. Data: Planet

Example 2: Invasion of Ecotourism Concessions in southern Peru (Madre de Dios)

Image 40e shows the recent deforestation within two ecotourism concessions along the Las Piedras River in the Madre de Dios region. Red indicates the 2016 GLAD alerts (67.3 hectares). Note that the Las Piedras Amazon Center (LPAC) Ecotourism Concession represents an effective barrier against deforestation occurring in the surrounding concessions. According to local sources, the main drivers of deforestation in the area are related to the establishment of cacao plantations and cattle pasture (see s MAAP #23). Inset A indicates the areas shown in the high-resolution zoom below.

Image 40e. Data: UMD/GLAD, Hansen/UMD/Google/USGS/NASA, MINAGRI

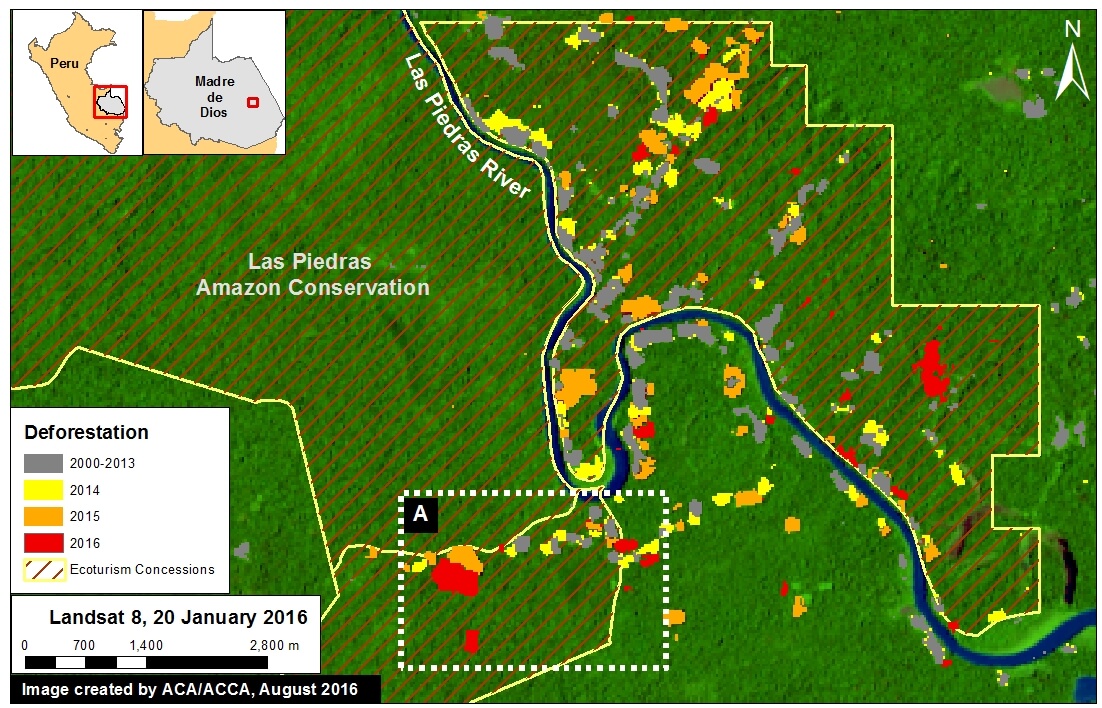
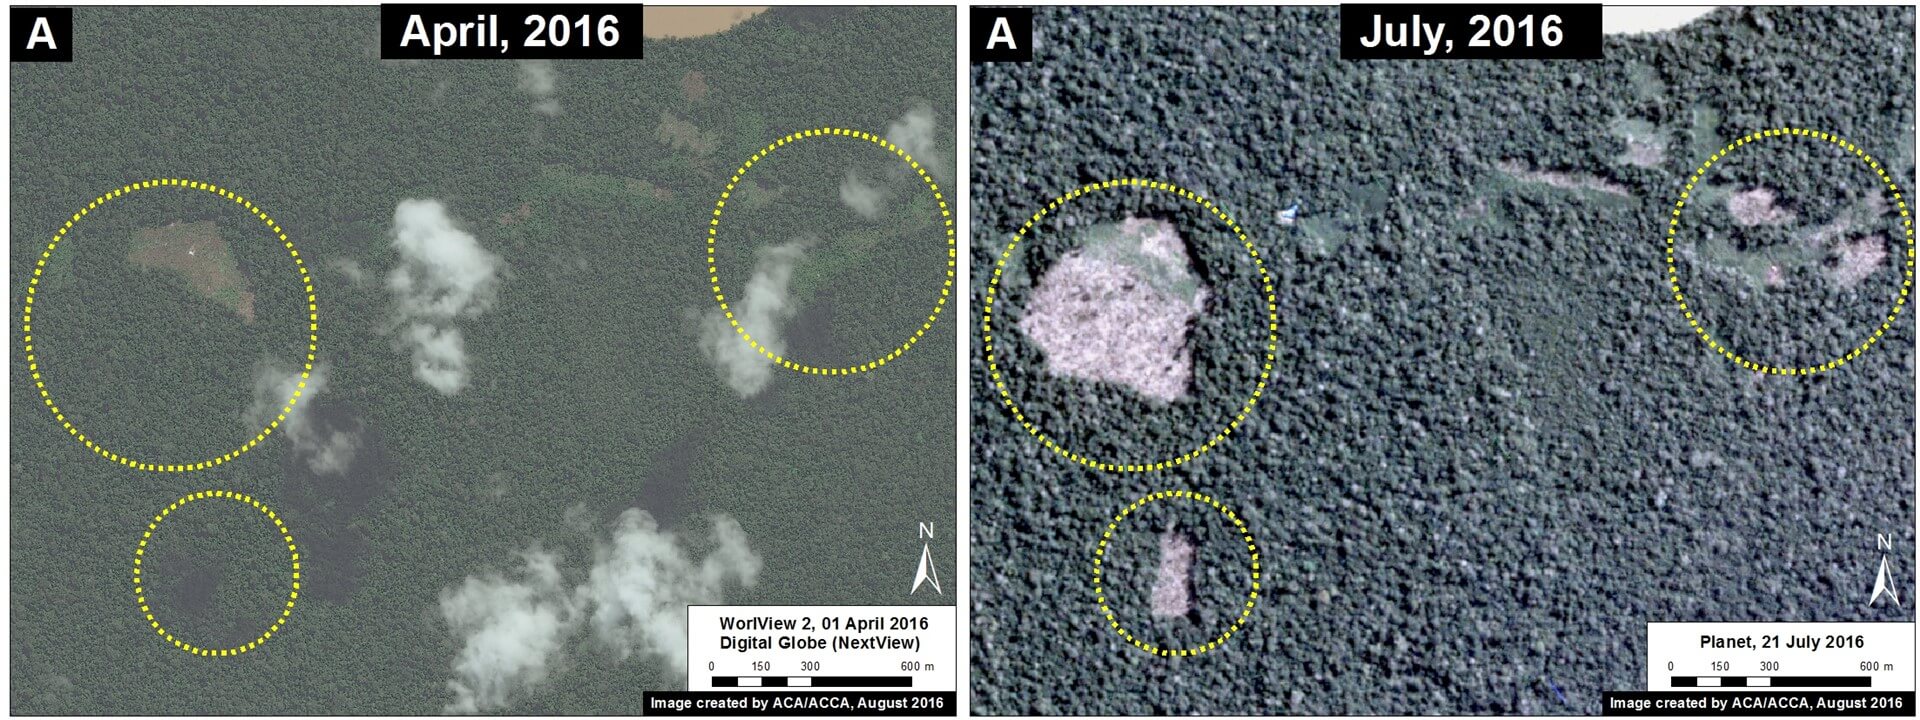
Image 40f shows high-resolution images of the area indicated by Inset A between April (left panel) and July (right panel) 2016. The yellow circles indicate areas of deforestation between these dates.

Image 40f. Data: Planet, DigitalGlobe (Nextview)

Example 3: Buffer Zone of Cordillera Azul National Park (Loreto)

Image 40g shows the recent deforestation within the western buffer zone of the Cordillera Azul National Park in the Loreto region. Red indicates the 2016 GLAD alerts (87.3 hectares). It is worth noting that this area is classified as Permanent Production Forest, not as an agricultural area.

Image 40g. Data: SERNANP, Landsat, UMD/GLAD, Hansen/UMD/Google/USGS/NASA

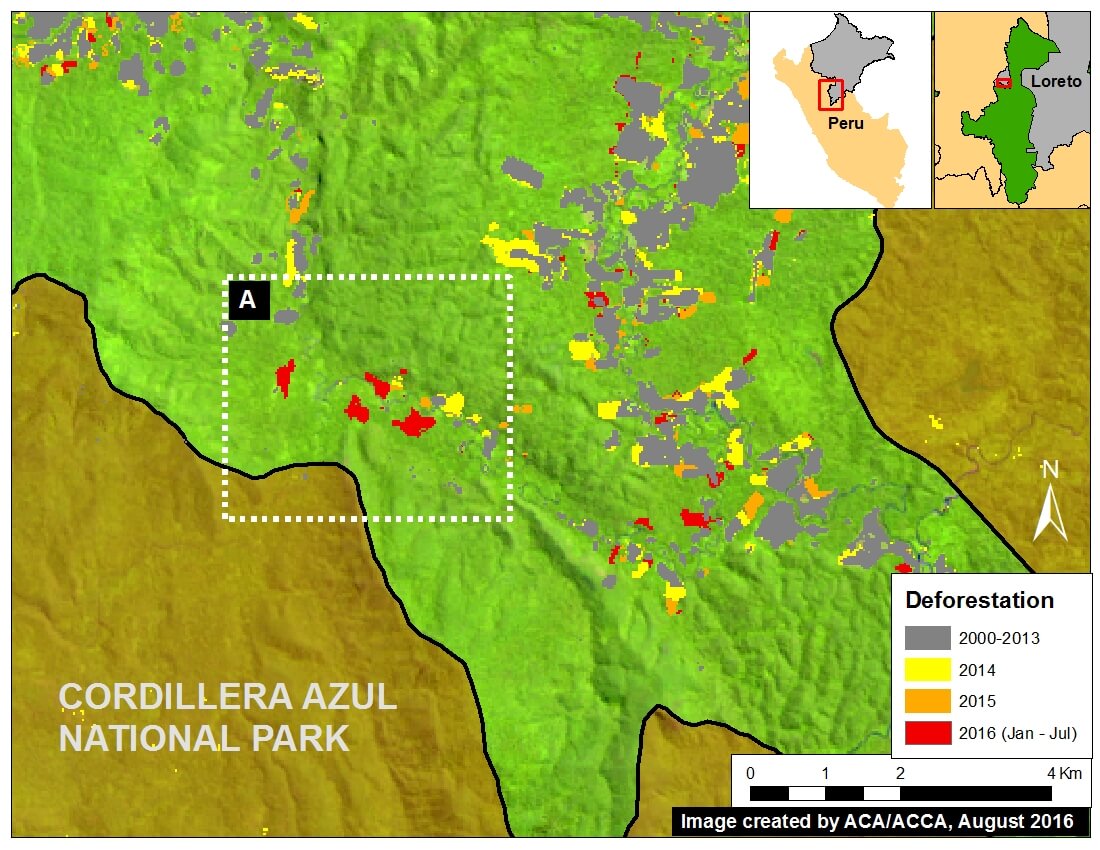
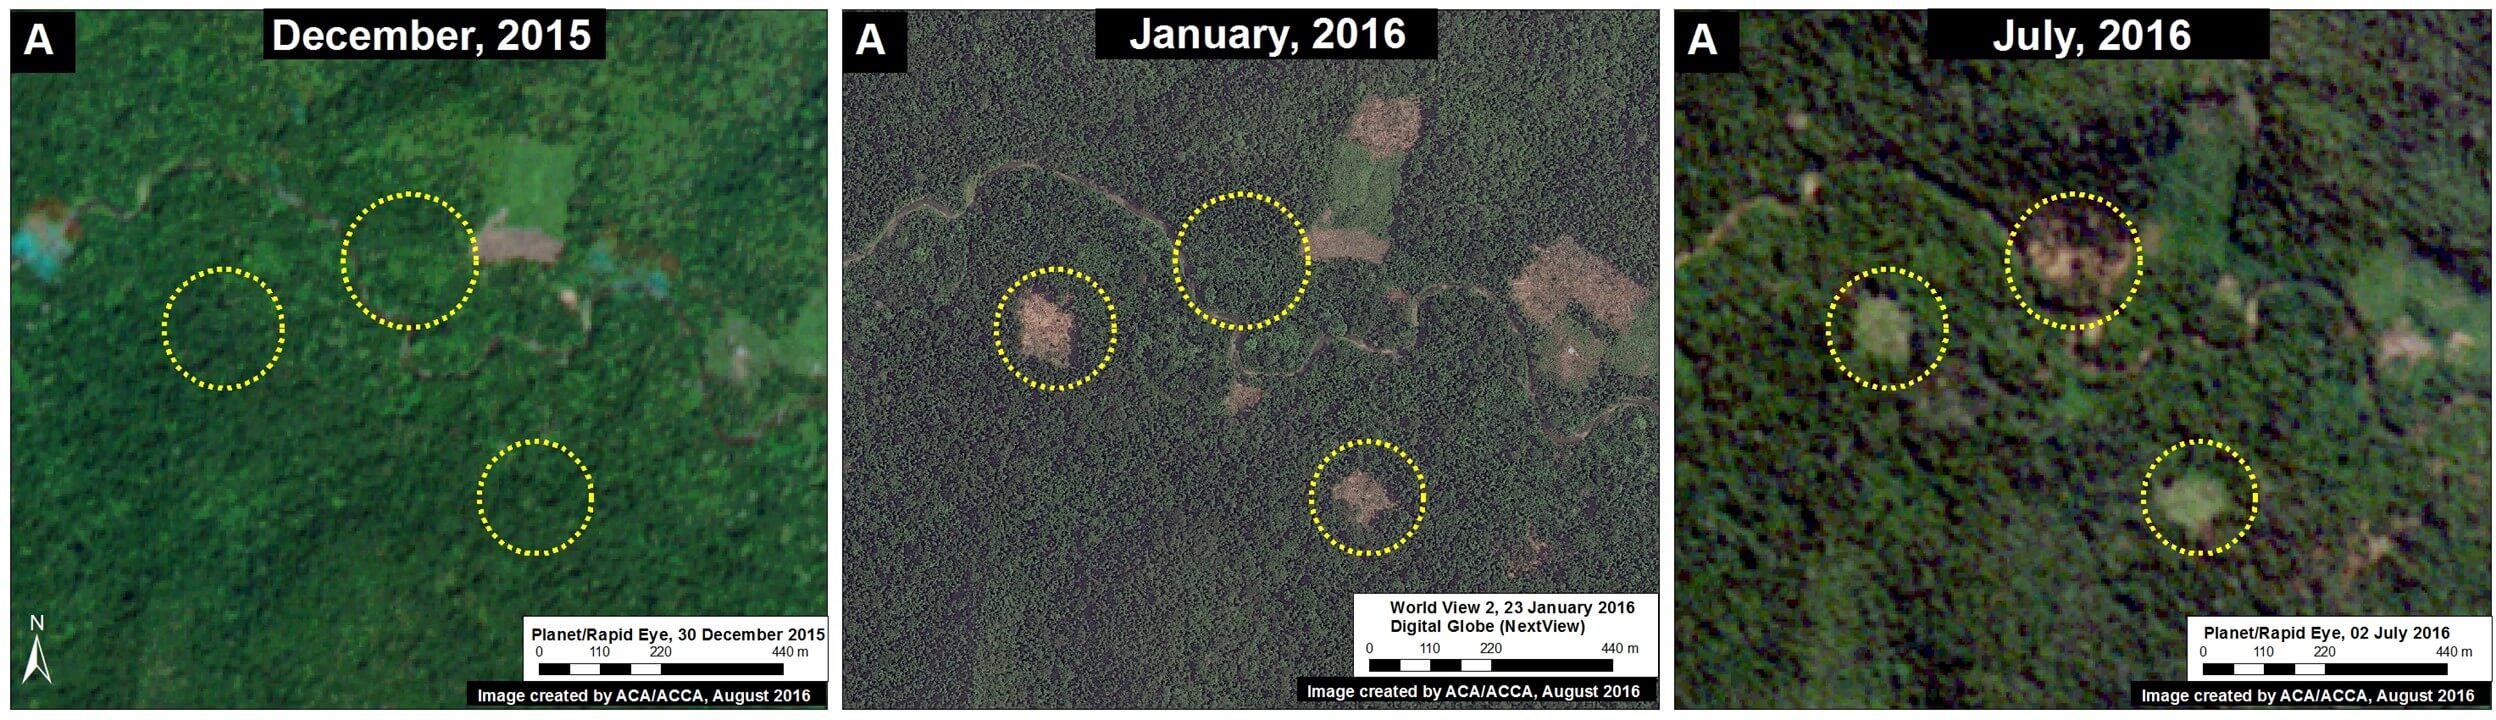
Image 40h shows high-resolution images of the area indicated by Inset A between December 2015 (left panel), January 2016 (central panel), and July 2016 (right panel). The yellow circles indicate areas that were deforested between these dates. The driver of the deforestation appears to be the establishment of small-scale agricultural plantations.

Image 40h. Data: RapidEye/Planet, Digital Globe (Nextview)

Citation

Finer M, Novoa S, Goldthwait E (2016) Early Alerts of Deforestation in the Peruvian Amazon. MAAP: 40.


MAAP #39: Gold Mining Deforestation Within Tambopata National Reserve Exceeds 865 Acres

Based on analysis of satellite imagery, we have documented that the deforestation due to illegal gold mining activities within Tambopata National Reserve (Madre de Dios region) now exceeds 350 hectares (872 acres) since the initial invasion in late 2015 (see Image 39a). Although the rate of deforestation has decreased since April, when the Peruvian government installed a permanent control post* in the area, it is clear that the deforestation continues to expand.  In the Image, we highlighted the most recent deforestation (June and July 2016) in red to emphasize the current fronts. Insets A and B indicate the areas detailed in the zooms below.

*A recent article in the New York Times highlighted the extreme difficulty faced by the Peruvian government in cracking down on the illegal mining. Yesterday, the leading Peruvian newspaper El Comercio reported that the control post has been abandoned due to lack of resources.

Image 39a. Data: Planet, SERNANP, MAAP

Zoom A

In the following images, we show high-resolution examples of the recent deforestation within the reserve. Image 39b shows the deforestation that occurred between May 30 (left panel) and June 20 (right panel), 2016 in the area indicated by Inset A. The red circles indicate primary zones of new deforestation between these dates.


Image 39b. Data: Planet, SERNANP

Zoom B

Image 39c shows the deforestation between May 3 (left panel) and July 21 (right panel), 2016 in the area indicated by Inset B. The red circles indicate primary areas of new deforestation between these dates.

Image 39c. Data: Digital Globe (Nextview), SERNANP

Citation

Novoa S, Finer M, Olexy T (2016) Gold Mining Deforestation within Tambopata National Reserve exceeds 350 Hectares. MAAP: #39


MAAP #30: Gold Mining Invasion of Tambopata National Reserve Intensifies

As described previously in MAAP #21, the illegal gold mining invasion of the Tambopata National Reserve began in late 2015. Here in  MAAP #30, we confirm that this invasion continues to intensify in 2016.

Image 30a shows the invasion zone, where we document that the illegal mining is advancing on seven fronts within the northwest section of the reserve and has thus far directly caused the deforestation of 130 hectares (320 acres) since September 2015. Below, we show high-resolution zooms of fronts 1-5 (Inset A) and a major mining camp recently established just outside of the Reserve (Inset B).

Image 30a. Data: Planet Labs, SERNANP

Invasion of Tambopata: Fronts 1-5

Image 30b shows the rapid expansion of deforestation in 5 of the fronts inside the Reserve between the end of January (left panel) and March (right panel) of 2016. This image corresponds to Inset A in Image 30a. Further below, Images 30c and 30d show high-resolution zooms of these 5 fronts.

Image 30b. Data: Planet Labs, SERNANP

Zoom of Fronts 1 & 2

Image 30c shows a zoom of deforestation fronts 1 and 2 between January (left panel) and March (right panel) of 2016.

Image 30c. Data: Planet Labs, SERNANP

Zoom of Fronts 3, 4, & 5

Image 30d shows a zoom of fronts 3, 4, and 5 between January (left panel) and March (right panel) of 2016.

Image 30d. Data: Planet Labs, SERNANP

Major Mining Camp Adjacent to Tambopata Reserve

Image 30e shows, in high-resolution, the establishment of a major mining camp in front of the invaded section of the Reserve (and within the Reserve’s official buffer zone). This Image corresponds to Inset B in Image 30a.

Image 30e. Data: WorldView-2 de Digital Globe (NextView).

Using Radar to Confirm Invasion Continues

In early 2016, the Peruvian government led two major interventions (on January 21 and February 23, respectively) against the illegal miners operating in the interior of the Reserve. However, Image 30f shows in red the continued advance of deforestation (44 hectares) between March 1 (left panel) and March 25 (right panel). In other words, using radar technology (which can pierce through cloud-cover) we can confirm that deforestation continued to advance after the government interventions.

Image 30f. Data: Sentinel-1, SERNANP

Finer M, Novoa S, Olexy T (2016) Invasion of Tambopata National Reserve Intensifies. MAAP: 30.


MAAP #29: Construction of New Road Between Manu National Park and Amarakaeri Communal Reserve (Madre De Dios)

Here in MAAP #29, we describe the Nuevo Eden-Boca Manu-Boca Colorado road project in the southern Peruvian Amazon (Madre de Dios region). The objective of this article is to show the current state of construction and quantify the direct and indirect deforestation caused thus far by the road. This is a controversial road project because it cuts through the buffer zones of two important protected areas, the Amarakaeri Communal Reserve and Manu National Park*.

Image 29a. Data: SERNANP, USGS, MINAGRI, IBC, CLASlite, PNCB/MINAM, Hansen/UMD/Google/USGS/NASA, SPOT

Image 29a shows the general context of the area between Amarakaeri  and Manu where the road is being constructed. The yellow line indicates the section of road built in 2015 (11.6 km) between the towns of New Eden and Shipetiari (see right panel for high-resolution image of this construction). The red line indicates the new section under construction thus far in 2016 (21.8 km). Thus, in total, we have documented the construction of 33.4 km of road within the Amarakaeri Communal Reserve buffer zone. Finally, the pink line indicates the future road section planned to Boca Manu and then to Boca Colorado.


Road Construction in 2015

Image 29b shows a series of satellite images (Landsat) that illustrate the rapid road construction during 2015. The first two panels show the construction of 11.6 km between February (left panel) and October (central panel) 2015. The yellow arrows in the central panel indicate the direct deforestation (20 hectares) associated with construction of the route. The yellow circles in the right panel indicate the indirect (secondary) deforestation associated with the road (12 hectares). Thus, in total, we have documented the deforestation of 32 hectares (or 79 acres) associated with the road as of mid-March 2016.

Image 29b. Data: NASA/USGS.

New Road Construction in 2016

Image 29c shows the continued road construction (2.9 km) between January and mid-March 2016 (see orange arrows in the left panel). Moreover, using high-resolution imagery provided by Planet Labs, the right panel shows a new path (see red arrows) that is likely the leading edge of the current road construction. This path now extends an additional 19 km in the direction of Boca Manu (see Image 29d).

Image 29c. Data: NASA/USGS, Planet Labs

Image 29d. Data: NASA/USGS

References

*MINAM (2016) MINAM está en contra de predictamen que permitiría la construcción de la carretera en zona de amortiguamiento del Manu y de Amarakaeri. http://www.minam.gob.pe/perucrecimiento/2016/02/29/minam-esta-en-contra-de-predictamen-que-permitiria-la-construccion-de-la-carretera-en-zona-de-amortiguamiento-del-manu-y-de-amarakaeri/

MINAM (2015) MINAM y SERNANP manifiestan preocupación por aprobación de ley que declara de interés nacional carretera en zona de amortiguamiento del Manu y Amarakaeri. http://www.minam.gob.pe/notas-de-prensa/minam-y-sernanp-manifiestan-preocupacion-por-aprobacion-de-ley-que-declara-de-interes-nacional-carretera-en-zona-de-amortiguamiento-del-manu-y-amarakaeri/


Citation

Finer M, Novoa S, Olexy T (2016) Construction of a New Highway between Manu National Park and Amarakaeri Communal Reserve (Madre de Dios), 2016. MAAP: 29.


MAAP #24: Illegal Gold Mining Penetrates Deeper into Tambopata National Reserve

*NoteDuring the preparation of this analysis, the Peruvian government conducted an operation against the illegal gold mining activity in the area described below (see this news article in Spanish for more information).

In MAAP #21, we revealed, using high-resolution images, the first sign of an invasion into the Tambopata National Reserve (an important natural protected area in the southern Peruvian Amazon) by illegal gold mining activities. Here in MAAP #24, we show two additional types of satellites imagery (due to lack of new high-resolution image) indicating that the illegal gold mining deforestation continues to penetrate deeper into the Reserve.

Image 24a. Landsat images showing the expansion of deforestation inside the Tambopata National Reserve between December 2015 (left panel) and January 2016 (right panel). Data: USGS, SERNANP.

Image 24a shows a comparison between two Landsat images (30 m resolution) indicating that the deforestation continued to increase within the Reserve between December 2015 (left panel) and January 2016 (right panel). The red circles indicate the general location of the newly deforested areas, which appear pink (soil without forest cover) and blue (wastewater pools) in contrast to the green (standing forest). The deforestation inside the Tambopata National Reserve between December 2015 and January 2016 is approximately 20 hectares (49 acres).


Image 24b is the base map showing the area described above in a larger context. The red inset box indicates the area shown in Image 24a.

Image 24b. Reference Map of mining area. Data: SERNANP, WorldView-2 of Digital Globe (NextView).

Radar: Powerful New Tool

Image 24c. Radar images showing the expansion of deforestation inside the Tambopata National Reserve between November 2015 (left panel) and January 2016 (right panel) Data: SERNANP, Sentinel-1

Image 24c shows, for the first time in MAAP, information from a radar satellite (Sentinel-1 from the European Space Agency). Unlike multi-spectral Landsat imagery that is vulnerable to clouds blocking the view, radar imagery is useful year-round (even the Amazon rainy season) because it can penetrate through cloud cover. In the displayed images, the shades of gray are related to the topography and the height of the forest. Lower areas, such as recently deforested lands and bodies of water, appear darker (almost black) in color, while higher areas such as standing forests appear lighter in color. Image 24c confirms the increase in deforestation between November 2015 (left panel) and January 2016 (right panel) within the area indicated above (see the red boxes).


Citation

Finer M, Novoa S, Olexy T (2016) Illegal Gold Mining Penetrates Deeper into Tambopata National Reserve. MAAP: 24.


MAAP #22: Yaguas – Another Big Conservation Opportunity For Peru

Peru recently celebrated a major conservation victory for 2015 with the creation of Sierra del Divisor National Park. Prior to this announcement, Sierra del Divisor was classified as a Reserved Zone, which is a temporary measure to protect an area of biological importance until the government is able to determine a final designation. In these cases, national park status represents the strongest possible final designation.

Now in 2016, there is the opportunity for another major conservation victory in Peru: creation of Yaguas National Park. Yaguas received Reserved Zone status in 2011 and is now awaiting its final designation. Yaguas Reserved Zone is both big (868,928 hectares or 2,147,168 acres) and remote, located in extreme northeast Peru within the department of Loreto (see Image 22a).

Image 22a. Yaguas Reserved Zone. Data: USGS, SERNANP, PNCB/MINAM, Hansen/UMD/Google/USGS/NASA

Note that Yaguas is a critical part of a series of protected areas that provide landscape level biological connectivity in northeast Peru. In addition, Yaguas borders and complements a large protected Colombian landscape, forming one of the largest assemblies of protected areas and indigenous lands in the Amazon.


Deforestation Analysis

Yaguas Reserved Zone is the rare example of an area in extremely good conservation condition. As seen In Image 22b, we detected virtually no deforestation within or surrounding the reserve. Note that the background in Image 22b is a Landsat image (30 m resolution) from December 2015 showing the reserve is completely covered with intact forest.

Image 22b. Yaguas Deforestation analysis. Data: USGS, PNCB/MINAM, Hansen/UMD/Google/USGS/NASA, MINAGRI, SERNANP

Carbon Analysis

Dr. Greg Asner (Carnegie Institution for Science) and the Peruvian Ministry of the Environment recently produced a high-resolution carbon map of Peru (Asner et al. 2014 a,b). As seen in Image 22c, much of the reserve contains very high carbon levels. Using this data, we calculated that Yaguas Reserved Zone contains approximately 102 million metric tons of above-ground carbon, one of the highest totals for a protected area in all of Peru.

Image 22c. High-resolution carbon geography of the Yaguas Reserved Zone. Data: Asner et al. 2014 a,b.

Asner GP, Knapp DE, Martin RE, Tupayachi R, Anderson CB, et al. (2014 a) Targeted carbon conservation at national scales with high-resolution monitoring. Proceedings of the National Academy of Sciences111(47), E5016-E5022.

Asner GP, Knapp DE, Martin RE, Tupayachi R, Anderson CB, et al. (2014 b) The high-resolution carbon geography of Peru. Berkeley, CA: Minuteman Press.


Biodiversity

The Yaguas Reserved Zone also contains extremely high levels of biodiversity, particularly for fish. In fact, according to a rapid biological inventory by the Field Museum in 2010, Yaguas may be home to the highest fish diversity in Peru. During the inventory, scientists recorded 337 fish species in three weeks, far more than any other rapid inventory in Peru (see Image 22d). Biologists estimate that Yaguas is home to around 550 fish species, making it one of South America’s most diverse aquatic ecosystems.

The Reserved Zone (and proposed national park) was specifically designed to protect this extraordinary aquatic diversity. It contains a complete gradient of lowland river aquatic habitats, from headwaters (first order and intermediate) and springs to lowland areas encompasing habitats such as floodplains, lakes, swamps, bogs, and a meandering main river (see Images 22e and 22f). Importantly, unlike most of the major rivers protected by Peruvian national parks, the Yaguas River is born in the Amazon lowlands, not in the Andes. Thus, it contains hydrological processes and riparian habitats that are not yet strictly protected by the Peruvian system of protected areas.

Image 22d. Number of fish species recorded in rapid inventories of the Yaguas Reserved Zone and 10 other sites in Loreto, Peru. Data: http://fm2.fieldmuseum.org/rbi/results.asp

Image 22e. Aerial view of Yaguas River. Photo Credit: Alvaro del Campo (Field Museum)

Image 22f. Aerial view of Yaguas River and the Cachimbo tributary. Photo Credit: Alvaro del Campo (Field Museum)

References:

Hidalgo, M. H., y A. Ortega-Lara. 2011. Peces. Pp. 98–108 y 308–329 en N. Pitman, C. Vriesendorp, D. K. Moskovits, R. von May, D. Alvira, T. Wachter, D. F. Stotz y Á. del Campo, eds. Perú: Yaguas-Cotuhé. Rapid Biological and Social Inventories Report 23. The Field Museum, Chicago. http://fm2.fieldmuseum.org/rbi/results_23.asp

Pitman, N., C. Vriesendorp, D. K. Moskovits, R. von May, D. Alvira, T. Wachter, D. F. Stotz y Á. del Campo, eds. 2011. Perú: Yaguas-Cotuhé. Rapid Biological and Social Inventories Report 23. The Field Museum, Chicago. http://fm2.fieldmuseum.org/rbi/results_23.asp


Acknowledgments

We thank the Field Museum and Instituto del Bien Común for helpful comments and information.

Citation

Finer M, Novoa S (2015) Another Big Conservation Opportunity for Peru: Yaguas.


MAAP #21: Illegal Gold Mining Deforestation Enters Tambopata National Reserve (Madre De Dios, Peru) [High-Resolution View]

*Note: During the review process for this article, a major operation against illegal mining activities was carried out by the Peruvian government in the area described below.

Image 21a illustrates a recent illegal gold mining invasion of the Tambopata National Reserve. Tambopata is an important protected area in the southern Peruvian Amazon (department of Madre de Dios). Image 21a compares two high-resolution (0.5 m) images taken two months apart over the same area along the northern border of the reserve. One can clearly see the beginning of the illegal gold mining activity and deforestation within the reserve between September (left panel) and November (right panel) 2015. For more context regarding the area in question, see the yellow box in Image 21b.

Image 21a. Recent invasion of Tambopata National Reserve. Data: SERNANP, WorldView-2 and WorldView-3 of Digital Globe (NextView).

Reference Map

Image 21b is a reference map showing the above detailed area in the larger context between the northern border of the Tambopata National Reserve and the illegal gold mining zone known as La Pampa. The yellow box corresponds to the area detailed in Image 21a. Note that the original boundary of the reserve created in 2000 no longer coincides with the route of the Malinowski River due to its natural movement over time.

Image 21b. Reference Map. Data: SERNANP, WorldView-2 of Digital Globe (NextView).

Deforestation Data

Image 21c presents an updated analysis of the deforestation in the area between La Pampa and the Tambopata National Reserve. In this specific area, we documented the deforestation of 2,518 hectares (6,222 acres) between 2013 and 2015, the vast majority of which is clearly linked to illegal gold mining activities. The majority of this recent deforestation has occurred in La Pampa, a bit north of the reserve (but within its buffer zone). However, recent deforestation has also occurred along the Malinowski river, which forms the northern boundary of the reserve in this area.

In Image 21c, the data from 2000-2014 came from Hansen/UMD/Google/USGS/NASA, while the data from 2015 came from our own analysis using CLASlite.

Image 21c. Analysis of deforestation. Data: CLASlite, Hansen/UMD/Google/USGS/NASA, SERNANP, USGS, WorldView-2 of Digital Globe (NextView).

Citation

Finer M, Novoa S, Snelgrove C, Peña N (2015) Confirming an Illegal Gold Mining Invasion of the Tambopata National Reserve (Madre de Dios, Peru) [High-Resolution View]. MAAP #21.

Image #15: Sierra Del Divisor – New Logging Road Threatens Northern Section of Proposed National Park

In MAAP #7, we emphasized the need to promote the Sierra del Divisor Reserved Zone to the category of National Park due to the growing threats within and around the area. Here in MAAP #15, we show how the construction of a new logging road threatens the northwest section of the current Reserved Zone. New high-resolution images reveal that the construction of this logging road has continued to expand in 2015, and now even crosses a corner of the Reserve.

In addition, in anticipation of the upcoming visit of Peruvian President Ollanta Humala to the United Nations in New York to discuss climate change, we present data on the levels of carbon stored in the proposed Sierra del Divisor National Park.

Image 15a. Landsat (30 m res) images of the new logging road crossing the Sierra del Divisor Reserved Zone. Data: USGS, SERNANP

Image 15a shows the most recent expansion of the logging road between June (left panel) and September (right panel) 2015. For more context, note that the area displayed in Image 15a corresponds to the dashed box marked with the letter “A” in Image 15c.

Image 15b displays a high-resolution (1.5 m) image from August 7 of the section of road crossing the northern section of the Sierra del Divisor Reserved Zone.

Image 15b. High-resolution image of logging road crossing northern tip of Reserved Zone. Data: SPOT 7 Airbus.

Expansion 2012 – 2015

In Figure 15c, we show the expansion of this logging road from 2012 to 2015, totaling approximately 75 km of new road construction during these three years.

Image 15c. Expansion of the logging road in the northeast sector of the Reserve Zone. Data: MINAM-PNCB/MINAGRI-SERFOR, SERNANP, USGS.

Carbon Data


Imagen 15d. High-resolution carbon geography of Sierra del Divisor area. Data: Asner et al. 2014 a,b.

Dr. Greg Asner (from the Carnegie Institution for Science) and colleagues recently produced a high-resolution carbon map of Peru (Asner et al. 2014 a,b).

According to this data, the Sierra del Divisor Reserved Zone has the second largest carbon stock among all Peruvian protected areas (behind only Alto Purus National Park).

As seen in Image 15d, much of the proposed national park area contains high to very high carbon levels. Using this data, we calculated that the proposed Sierra del Divisor National Park contains approximately 165 million metric tons of above-ground carbon.


SERNANP Response

In response to this article, SERNANP (the Peruvian protected areas agency) issued this statement:

The deforestation alert in the northwest sector parallel to the Sierra del Divisor Reserved Zone is caused by the improvement of an alleged older road that runs along the natural protected area, which is being operateded by a neighboring forest concessionaire. We denounced this before the Special Prosecutor for Environmental Matters in Loreto in 2012, as we considered it irregular and a threat to the protected area.

[La deforestación que se advierte en el sector noroeste paralelo a la Zona Reservada Sierra del Divisor se origina por el mejoramiento de una supuesta carretera antigua que viene ejecutando un concesionario forestal colindante con el área natural protegida, la cual denunciamos ante la Fiscalía Especializada de Materia Ambiental – Loreto en el año 2012, por considerarla irregular y constituirse en una amenaza a este espacio protegido.] This past August, the Special Prosecutor scheduled an inspection, which was conducted jointly with the Public Prosecutor of the Ministry of the Environment. We have been making every effort to ensure that the Special Prosecutor performs the corresponding actions according to law, such as requiring OSINFOR to supervise the forest concessionaire due to the irregular events that we denounced.

[Recién en agosto último la Fiscalía programó la inspección fiscal, que se realizó conjuntamente con la Procuraduría Pública del Ministerio del Ambiente, en la cual venimos realizando todos los esfuerzos para que la Fiscalía Especializada realice las actuaciones que corresponde de acuerdo a Ley, así como requerir al OSINFOR supervise al concesionario forestal, por los hechos irregulares que denunciamos.] Lima, 17 de setiembre del 2015

References

Asner GP, Knapp DE, Martin RE, Tupayachi R, Anderson CB, et al. (2014 a) Targeted carbon conservation at national scales with high-resolution monitoring. Proceedings of the National Academy of Sciences, 111(47), E5016-E5022.

Asner GP, Knapp DE, Martin RE, Tupayachi R, Anderson CB, et al. (2014 b) The high-resolution carbon geography of Peru. Berkeley, CA: Minuteman Press.


Citation

Finer M, Novoa S (2015) Sierra del Divisor – New logging road crosses northern section of Reserve Zone MAAP: Image #15. Link: https://maaproject.org/2015/09/image15-sierra-divisor/


Image #11: Importance of Protected Areas in The Peruvian Amazon

The Peruvian national protected areas system, known as SINANPE, is critically important to Amazon conservation efforts in the country.

There are currently 46 protected areas in the Peruvian Amazon under national or regional administration*. In total, these areas cover 19.5 million hectares and include a wide variety of designations, including areas of indirect use (those with strict protection, such as National Parks) and direct use (those that allow the exploitation of natural resources, such as National Reserves) under national administration and Regional Conservation Areas under regional administration.

Here, MAAP #11 presents a deforestation analysis that demonstrates the effectiveness of protected areas in relation to the surrounding landscape in the Peruvian Amazon.

Image 11a. Recent forest loss in relation to protected areas in the Peruvian Amazon. Data: SERNANP, PNCB-MINAM/SERFOR-MINAGRI, NatureServe.
Image 11a. Recent forest loss in relation to protected areas in the Peruvian Amazon. Data: SERNANP,

Key Results

Image 11a shows recent (2000 – 2013) forest loss patterns in relation to the current national protected area system in the Peruvian Amazon (Image 11b shows the same, but with zooms of the northern, central, and southern regions, respectively). Note that some of the documented forest loss surely comes from natural causes, such as landslides or meandering rivers.

Across all protected areas administered nationally (such as National Parks and National Reserves), we found that deforestation was significantly lower starting at 2 km within their boundaries compared to outside them (see Images 11b and 11c).

The rate of deforestation outside of protected areas is more than twice of that within them (within the 5 km buffer zone study area, see below).

Image 11b. Regional zooms (north, central, south) of recent forest loss in relation to protected areas. Data: SERNANP, PNCB-MINAM/SERFOR-MINAGRI, NatureServe.

Deforestation Analysis – Methods

We conducted a basic analysis of all protected areas administered nationally (National Park, National Sanctuary, Historic Sanctuary, National Reserve, Protection Forest, Communal Reserve, and Reserved Zone) to estimate their relative effectiveness in controlling deforestation in relation to the surrounding landscape. The forest loss data comes from the National Program of Forest Conservation for the Mitigation of Climate Change (PNCB) of the Ministry of the Environment of Peru. This deforestation analysis had two key components.

Image 11c. Illustration of spatial intervals for deforestation analysis.

First, we compared recent forest loss within versus outside each protected area at four different spatial intervals: 1 km, 2 km, 3 km, and 5 km (see Image 11c). In other words, starting at the boundary line for each area, we created a 1 km buffer both inside and outside the area and compared the relative (forest loss/area *100) deforestation. We then repeated this analysis for the other intervals. The establishment of these intervals areas is based on the assumption that the closer to the limits of each protected area, deforestation could be more related to anthropogenic activities in surrounding areas, which is expected to reduce the effect of natural losses due to changes in the courses of rivers and landslides in unstable areas.

Second, we controlled for protected area creation date. If an area was created prior to 2000, such as Manu National Park created in 1973, we used the complete 2000-2013 PNCB forest loss dataset. If an area was created after 2000, such as Alto Purus National Park created in 2004, we used just the forest loss dataset for the years following its creation (in this case, 2005-2013).

This analysis was designed to show general patterns, not be a definitive evaluation of the effectiveness of protected areas. A more complete evaluation could control for additional variables (such as slope, elevation, climate, distance to population centers, etc…).

Deforestation Analysis – Results


Image 11d. Results of deforestation analysis.

Across all protected areas administered nationally, we found that deforestation was significantly lower starting at 2 km within their boundaries compared to outside them (p < 0.05) (see Image 11d). The significance level increased by an order of magnitude between 3 and 5 km. We didn’t detect a significant difference between 1 km within and outside the protected area boundaries.

On average, we found that 0.5% of the area within protected areas experienced forest loss between 2000-2013, while outside the protected areas was nearly 1.2%. In other words, the rate of deforestation outside of protected areas is more than twice of that within them. Furthermore, as mentioned earlier, some forest loss within the protected areas surely comes from natural causes, such as landslides or meandering rivers.

Related Studies

As noted above, this analysis was designed to show general patterns, not be a definitive evaluation of the effectiveness of protected areas. Several other recent studies have pointed out the importance of controlling for additional variables.

In a study focused on the Brazilian Amazon, Pfaff et al (PLOS ONE 2015) found that is important to control for the location of protected areas, which is often in more isolated areas with lower deforestation pressures.

Specifically regarding the Peruvian Amazon, a study by the research organization Resources for the Future (2014) found that “the average protected area reduces forest cover change”. This study rigorously controlled for a number of key variables (such as elevation, slope, climate, and distance to cities), but used older and more limited forest loss and protected areas data.

*This total of 46 protected areas includes: a) all the categories considered part of SINANPE (including Reserved Zones and Regional Conservation Areas) except for Private Conservation Areas, and b) all areas that are totally or partially located in the Amazon basin.

SERNANP Response

In response to this article, SERNANP (the Peruvian protected areas agency) issued this statement:

Actualmente el SERNANP viene realizando una verificación en campo por parte del personal guardaparque de las Áreas Naturales Protegidas durante sus acciones de patrullaje merced a la información de pérdida de bosque proporcionada por el Ministerio del Ambiente, periodo 2013-2014, a fin de determinar si el cambio de la cobertura se debe a causas naturales o antrópicas. Esto podrá complementar el análisis desarrollado por ACCA.

Es importante señalar, que el SERNANP viene aplicando el enfoque ecosistémico en la planificación y gestión de las Áreas Naturales Protegidas, en este sentido desarrolla acciones que permiten evitar la deforestación al interior de estos espacios protegidos, pero a su vez nos proponemos que en su entorno se desarrollen actividades compatibles con la conservación que eviten el fraccionamiento del hábitat y permitan la sostenibilidad de la conservación de las Áreas Naturales Protegidas a futuro.

En este sentido, considerando de vital importancia generar alianzas con las entidades que toman decisiones en el territorio fuera de estos espacios, hemos establecido a nivel nacional un trabajo conjunto con los Gobiernos Regionales a fin de integrar las Áreas Naturales Protegidas dentro de corredores de conservación con otras modalidades de conservación que se impulsan a través de sus sistemas regionales de conservación. Con ello, se esperaría detener el fraccionamiento de hábitat alrededor de las Áreas Naturales Protegidas, lo que podría conllevar a su insostenibilidad a futuro. Al respecto, es preciso mencionar que los Sistemas Regionales de Conservación cuentan con un espacio de coordinación donde se reúnen las principales instituciones que gestionan territorio y en la cual se discuten las iniciativas de desarrollo social y económico para que se realicen en armonía con la conservación de la biodiversidad del país, el SERNANP forma parte de estos espacios a nivel nacional.


Citation

Finer M, Novoa S (2015) Importance of Protected Areas in the Peruvian Amazon. MAAP: Image #11. Link: https://maaproject.org/2015/08/image-11-protected-areas

MAAP #9: Confirming Forest Clearing for Cacao in Tamshiyacu (Loreto, Peru) Came from Primary Forest

Recall that in Image #2 we documented the rapid clearing of 2,126 hectares of primary forest between May 2013 and August 2014 for a new cacao project outside of the town of Tamshiyacu in the northern Peruvian Amazon (Department of Loreto).

However, the company that carried out the forest clearing (United Cacao, through its wholly-owned subsidiary in Peru, Cacao del Peru Norte) has responded “that this area had been used for farming since the late 1990s, and thus it was not primary forest…There was no high-conservation-value forest on that land (Cannon JC, 2015, mongabay.com).” In addition, the company’s website states that “The site was heavily logged of all tropical hardwoods in the 1980s.”

Here, in Image #9, we 1) publish new high-resolution (33 cm) satellite imagery that shows how the cacao project is expanding into dense, closed-canopy forest and 2) detail exactly how we determined that the vast majority of the clearing indeed came from primary forest. These findings are critically important because the company has major expansion plans.

Image of the Week 9a. Mosaic of very high-resolution (33 cm) images of the United Cacao plantation near Tamshiyacu, Peru, in June 2015. Colors indicate insets. Data: WorldView-3 from Digital Globe (NextView).

Key Results:

We obtained very high-resolution (33 cm) satellite imagery taken over the United Cacao plantation in June 2015 (see Image 9a). In this imagery, one can clearly see that the cacao project is embedded and expanding into dense, closed-canopy forest.

We analyzed a series of satellite (Landsat) images dating back to 1985 to determine that, prior to the arrival of United Cacao in 2013, the project area 1) had NOT been used for major farming activities, 2) was NOT heavily logged of all tropical hardwoods, and 3) was dominated (98%) by primary forest (see Image 9b). In fact, by analyzing spectral signatures in the Landsat images, we confirm that the area cleared by United Cacao in 2013 was dominated by primary forest (see Image 9c).

We show data from the Carnegie Airborne Observatory showing that the majority of the United Cacao project area had the highest possible value of carbon (over 150 tons per hectare) immediately prior to the forest clearing in 2013.

Finally, we present information indicating that the current documented forest clearing of 2,126 hectares may soon double or triple.

Landsat Time-series


Image 9b. Landsat time-series (1985-2012) of the future United Cacao plantation area (indicated by black box) prior to arrival of the company. Data: USGS

Image 9b displays a series of Landsat images dating back to 1985 showing that, prior to the arrival of United Cacao, the area was dominated (nearly 98%) by primary forest and NOT used for major agriculture activities or heavily logged of all tropical hardwoods.

In these Landsat images, dark green indicates forest cover, light green indicates secondary vegetation, pink indicates exposed ground (and is therefore a key indicator of recent forest clearing), and the scattered white and black spots indicate clouds and their shade.

In 1985, the future cacao project area (indicated by black box) was completely covered by forest with no signs of clearing, major logging, or farming. By 1995, there were a few scattered areas of cleared forest in the center of the future project area. By 2005, there was a slight expansion of these cleared areas in the center of the future project area. By 2012, immediately before the start of forest clearing, the future project area appeared much the same: a few scattered areas of cleared forest in the center, but the vast majority of the area was primary forest.

We defined primary forest as an area that from the earliest available image (in this case, from 1985) was characterized by dense closed-canopy coverage and experienced no major clearing events.

NDVI Analysis


Image 9c. NDVI analysis of the United Cacao plantation area prior to arrival of the company. Letters indicate significance (i.e., “a” values are significantly different than “b” values). Data: USGS.

To further investigate the issue of primary forest, we used the Landsat imagery to conduct an NDVI (Normalized Difference Vegetation Index) analysis. NDVI is a common index of photosynthetic activity, or “greenness,” based on the fact that different surfaces (primary forest, secondary forest, water, bare ground, etc…) reflect light (visible and near-infrared) differently.

As seen in Image 9c, we obtained NDVI measurements across four different years (1985, 1995, 2005, and 2012) for 100 random points from each of three different areas: 1) area cleared by United Cacao in 2013 (orange dots), 2) nearby protected area that is proxy for primary forest (yellow dots), and 3) disturbed area along a major river that is proxy for secondary forest (purple dots).

For all four years, we found that the NDVI values for the area cleared by United Cacao in 2013 were similar to those of the nearby protected area (in fact, these values were nearly identical in 1985 and 1995), but significantly different than the disturbed area along the major river. In other words, the forest cleared by United Cacao was nearly identical to our proxy for primary forest and significantly different than our proxy for secondary forest. Thus, we conclude that United Cacao cleared over 2,000 hectares of primary forest in 2013.

Carbon Data Tells the Same Story


Image 9d. High-resolution carbon map of United Cacao plantation area (indicated by black box) prior to forest clearing. Data: Asner et al (2014) The high-resolution carbon geography of Peru. Berkeley, CA: Minuteman Press.

The Carnegie Airborne Observatory, led by Dr. Greg Asner, and the Peruvian Ministry of Environment, recently produced a high-resolution carbon geography of Peru. Interestingly, they mapped the carbon content of the United Cacao plantation area immediately prior to the forest clearing.

As seen in Image 9d, the vast majority of the United Cacao project area had the highest possible value of carbon (over 150 tons per hectare) immediately prior to the forest clearing in 2013. The only exceptions were the scattered previously cleared areas identified in Image 9b.

According to Asner, “The carbon levels were extremely high, indicating that they were large, intact forests that we normally picture when we think of primary Amazon forest.”

More Forest Clearing Coming…


Image 9e. Project area map from the United Cacao website.

According to its website, United Cacao owns around 3,250 hectares near Tamshiyacu, and this total may soon increase to 4,000 hectares. In addition, the company has started an initiative with local farmers that may include an additional 3,250 hectares.

Thus, the current documented forest clearing of 2,126 hectares may soon double or triple.

Finally, it is worth mentioning that we detected a sawmill within the project area. This discovery raises the question, Has the company obtained the necessary permits for this activity?

Image 9f. A sawmill detected within the cacao project area. Inset: The pink dot indicates location of sawmill within the project area. Data: WorldView-3 de Digital Globe (NextView).

Citation

Finer M, Novoa S (2015) Demonstrating that Forest Clearing for Cacao in Tamshiyacu (Loreto, Peru) came from Primary Forest. MAAP: Image #8. Link: https://maaproject.org/2015/06/image-9-cacao-tamshiyacu/